| Performance Log in Database Table |
[This is preliminary documentation and is subject to change.]
Performance logging to database table is implemented in TOPICA version 4.21 and newer. |
This topic contains the following sections.
Performance logging to database table may be turned on/off by .config-file parameters:
Key | Valid values | Default value | Description | ||
|---|---|---|---|---|---|
PerformanceLog.Database.Enabled | true / false | true | Specifies whether performance data should be logged to the database. | ||
PerformanceLog.Database.ServerTiming.Enabled | true / false | true | Specifies whether server-side timing data should be logged to the database. | ||
PerformanceLog.Database.ServerAndClientTiming.Enabled | true / false | false | Specifies whether client-side timing data should be logged to the database.
| ||
PerformanceLog.Frameset | true / false | false | Turns performance measuring for rendering of frameset pages on/off. Frameset pages do not perform any action other that displaying frames - so it will seldom make sense to turn this on. |
As mentioned in performance logging it is the responsibility of the application developer to make any "custom" webforms inherit from CSC.SC.TOPICA4.TOPICA4Web.TopicaBasePage.
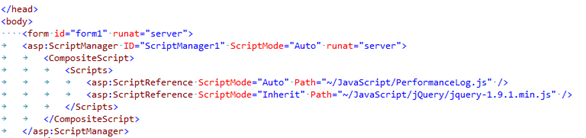
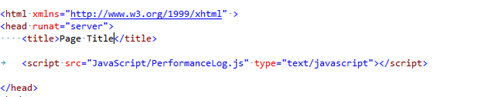
In addition to this, to enable client-side logging, a webform must reference the javascript file ~/JavaScript/PerformanceLog.js. This may be done in several ways
Performance Log data stored in the database in the table dbo.PerformanceLog. The table has the following columns.
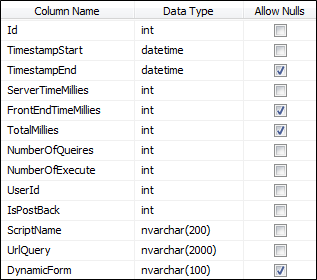
Column | Description |
|---|---|
Id | Unique identifier for each performance logging. |
TimestampStart | Timestamp indicating the start time of the performance measurement. |
TimestampEnd | Timestamp indicating the end time of the performance measurement. |
ServerTimeMilliSeconds | Time in milliseconds that was used on the server. |
ClientTimeMilliSeconds | Time in milliseconds that was used to download resources and rendering the page in the user's browser. |
TotalMilliSeconds | Total time in milliseconds it takes to process request on both the server and in the user's browser. |
NumberOfQueries | The number of Select Queries that was made for the request. |
NumberOfExecute | The number of Executes Queries that was made for the request. |
EmployeeUserId | Id of the user, in this case a user of type Employee, who was logged in while performance data was logged. |
PatientUserId | Id of the user, in this case a user of type Patient, who was logged in while performance data was logged. |
IsPostBack | Indicates whether a Request is a postback. |
ScriptName | Specifies the name of aspx page that had its performance logged. |
UrlQuery | Indicates the QueryString parameters that was in the URL as request was processed. |
DynamicForm | If the aspx page being requested is a dynamic form, this column will contain the name of the form. This is because all dynamic forms are generated from the same aspx page. |
Because performance data is written to a database table as structured information, it is searchable. The TOPICA framework contains a user interface that makes searching possible.
This user interface may currently be found in this way:
From main menu, select "Tools / Frameworks tools".
Select "Log / PerformanceLog / PerformanceLogSearch.aspx".
When performance logging is turned on for a long time, and the application has many users, the database table dbo.PerformanceLog will grow to contain MANY records. The table dbo.PerformanceLog is currently not indexed to allow fast queries. As a consequence, when the number of records in dbo.PerformanceLog reaches millions, queries may take excessively long time - making the search user interface useless. Therefore, make sure that the table does not grow too big. |
TOPICA versions 4.27 and newer contains scripts to delete records from dbo.PerformanceLog. These scripts are found close to the above mentioned user interface for searching.
Delete records older than 180 days.
Delete records older than 30 days.
TRUNCATE table dbo.PerformanceLog (delete ALL records). When the table has grown too big, even deleting older that x days will take too long time to execute. In this case, using TRUNCATE is the only usable option.
Set up a scheduled task to delete records older than xx days, and make this script run once every 24 hours (e.g. at night). This will prevent the table from growing too large. |