| Performance Log |
[This is preliminary documentation and is subject to change.]
The TOPICA framework logs performance data (time spent on rendering each pages, number of database queries and commands). This data can be used for performance monitoring / optimization.
Identify pages that take a long time to execute.
Identify pages that perform too many database queries (a large number of database accesses is typically the number one source for poor performance).
Check effects of optimizations by comparing performance data before and after an optimization has been made.
This topic contains the following sections.
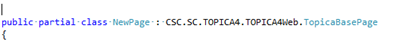
All pages / webforms in the TOPICA framework automatically write performance log information (when activated). This is because the performance logging is implemented in the base class CSC.SC.TOPICA4.TOPICA4Web.TopicaBasePage, that all pages in the framework inherit from:
When developing custom, application-specific WebForms, it is the responsibility of the application developer to make sure, that each Webform inherits from the base class CSC.SC.TOPICA4.TOPICA4Web.TopicaBasePage! |
Performance data from webservices (neither the built-in nor the auto-generated nor the custom ones) is NOT automatically collected! |
The measured elapsed time and number of database queries and commands are written to a destination, that depends on the data model version:
Data model 4.21 and newer:
Performance log data is written to a database table (dbo.PerformanceLog).
Because performance log data is written to a database table (as structured information), it is searchable in the user interface.
Data model 4.20 and older:
Performance log data is written to text files (on the web server).
Data in these text files are NOT searchable in the user interface.